
For demand planners and analysts
RoadMap TrailBlazer
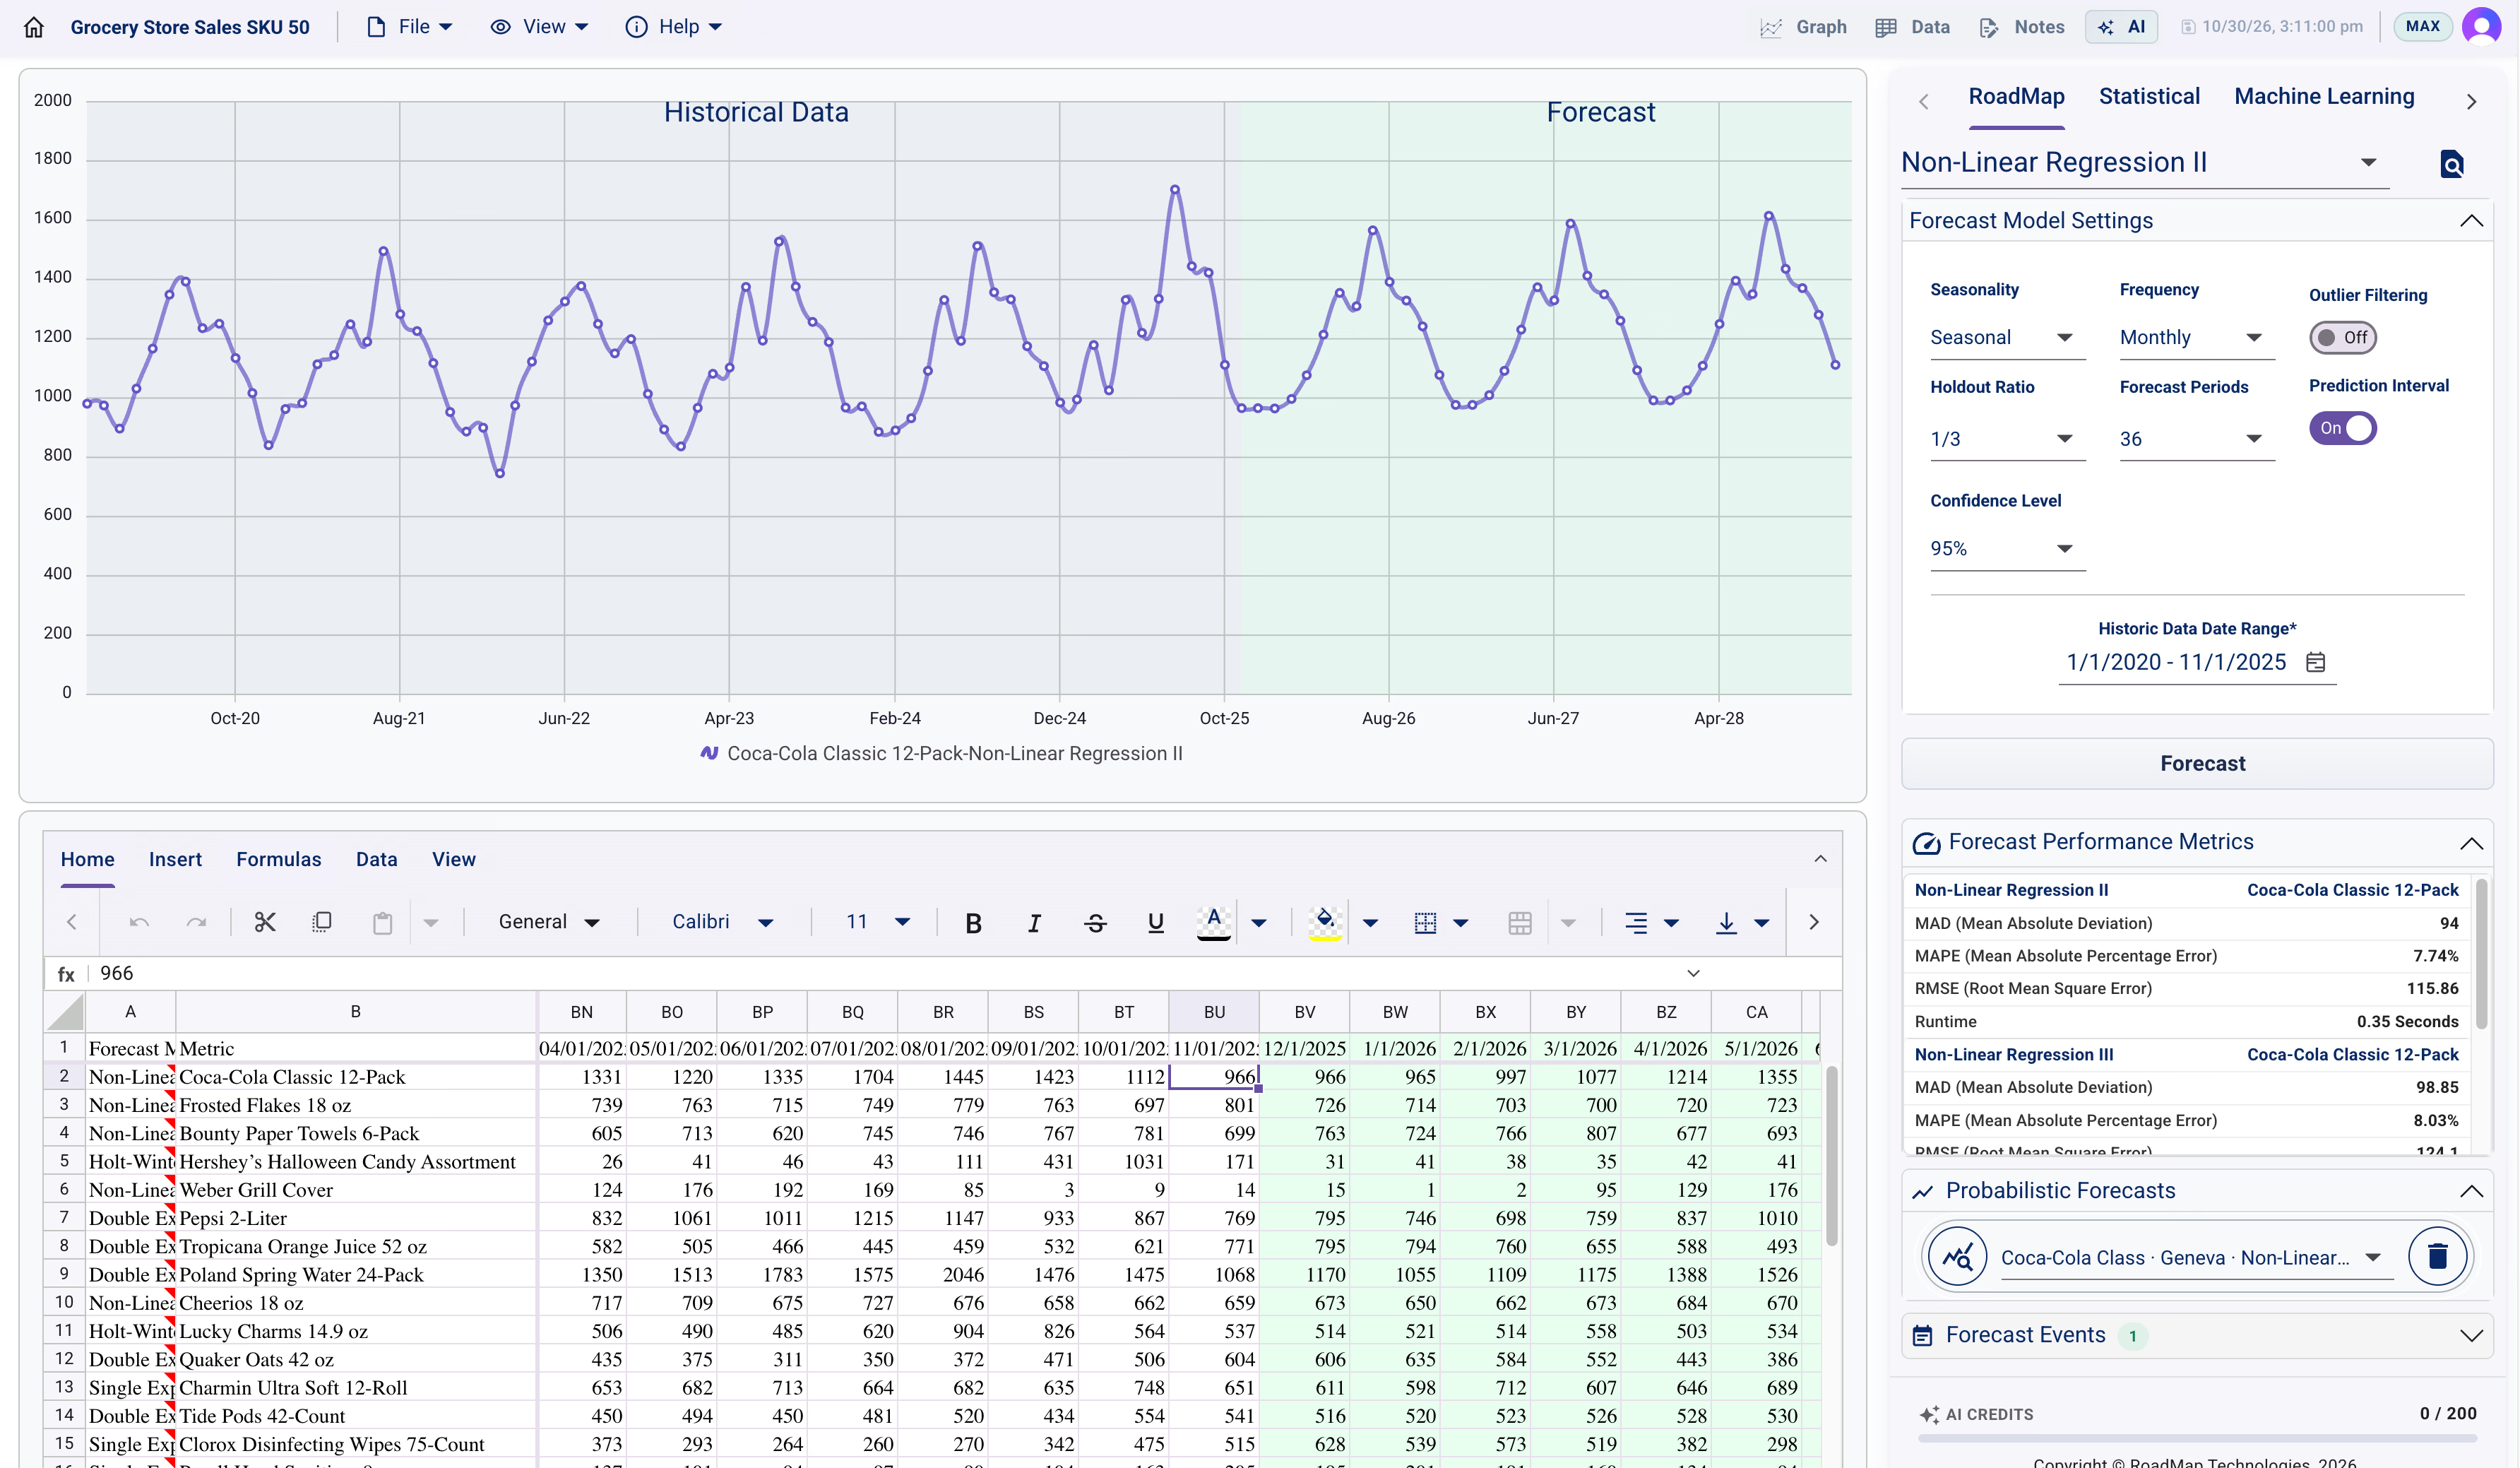
Free Forecasting workspace with AI Agents, in your browser.
- 40+ models
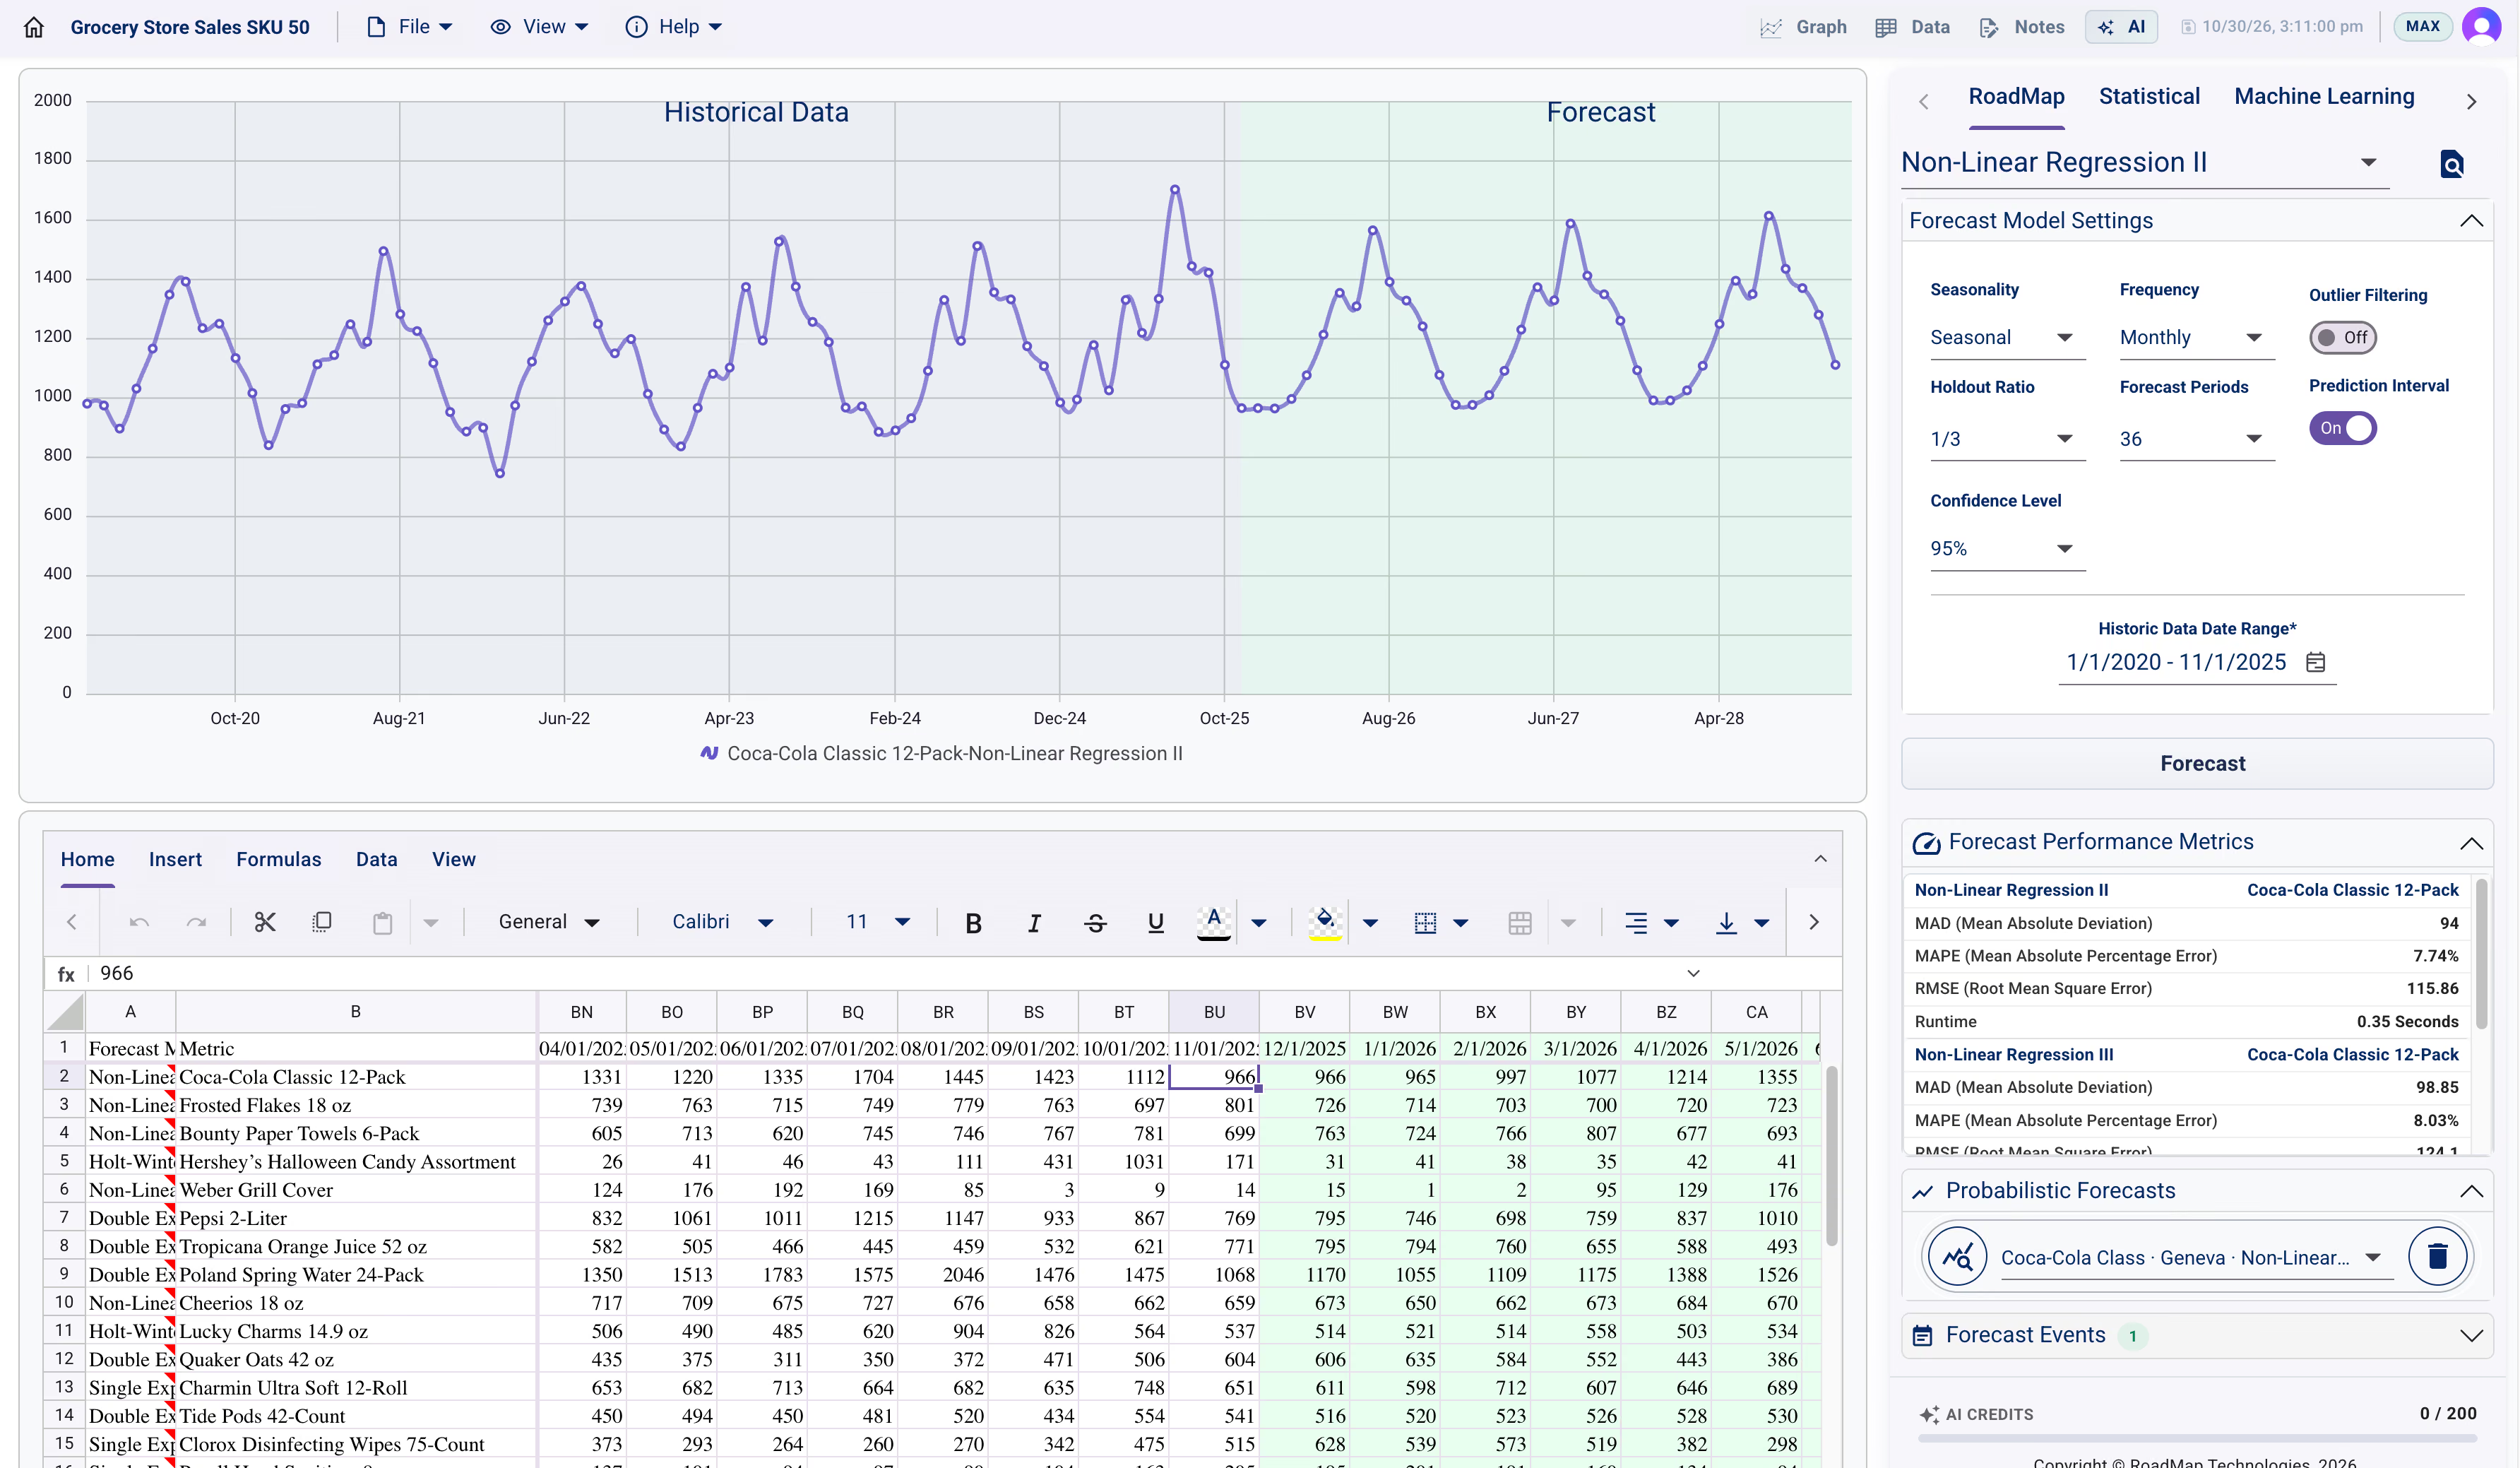
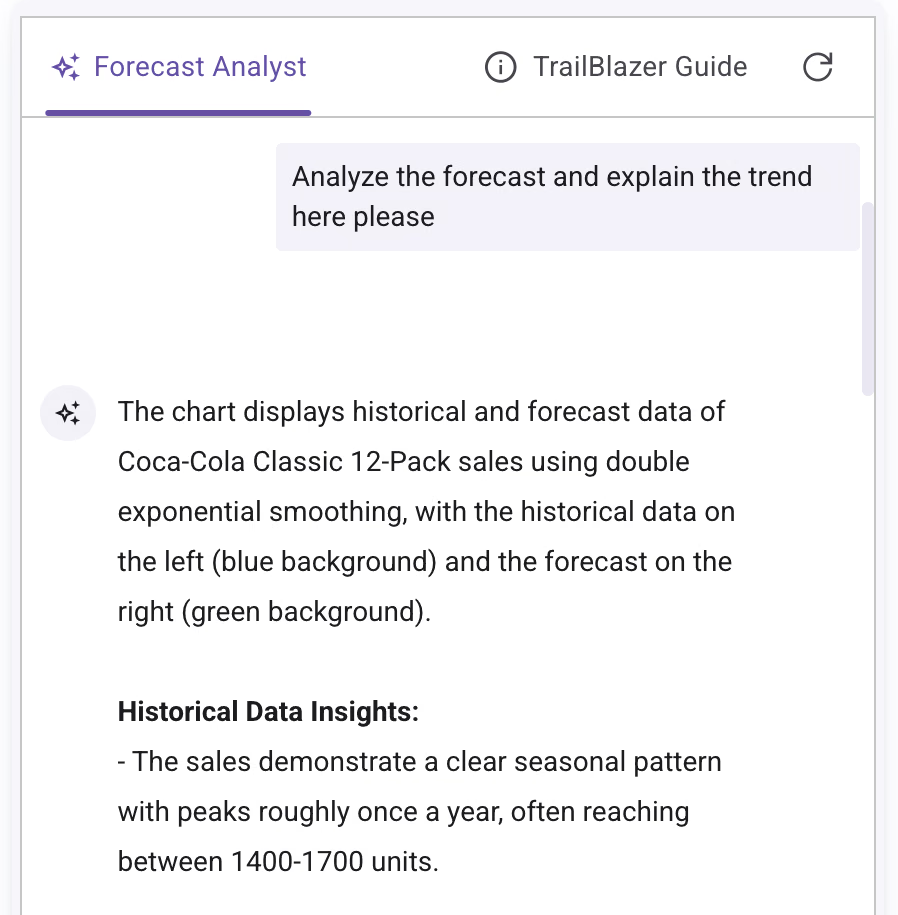
- AI Forecast Analyst
- AI Import Agent
- Conformal intervals
Free forever · Pro $34.99/mo
Open RoadMap TrailBlazerSince 1988Software · AI · Consulting · Data
Forecasting software, AI agents, expert consulting, and secure data pipelines that turn demand signals into inventory, supply, and launch decisions your team can stand behind.




For demand planners and analysts
Free Forecasting workspace with AI Agents, in your browser.
Free forever · Pro $34.99/mo
Open RoadMap TrailBlazerFor developers and AI agents
Lightning fast forecasting for your app or Claude agent.
pip install geneva-forecastGeneva Developer PortalRoadMap grew out of the Geneva Forecasting™ Engine, built at Harvard Business School in the 1980s and licensed by Oracle since 1999.
We have spent decades building, validating and running forecasts with Fortune 500 and life science planning teams, and the same people who wrote the engine still work on your model.
Geneva Forecasting™ API & MCP
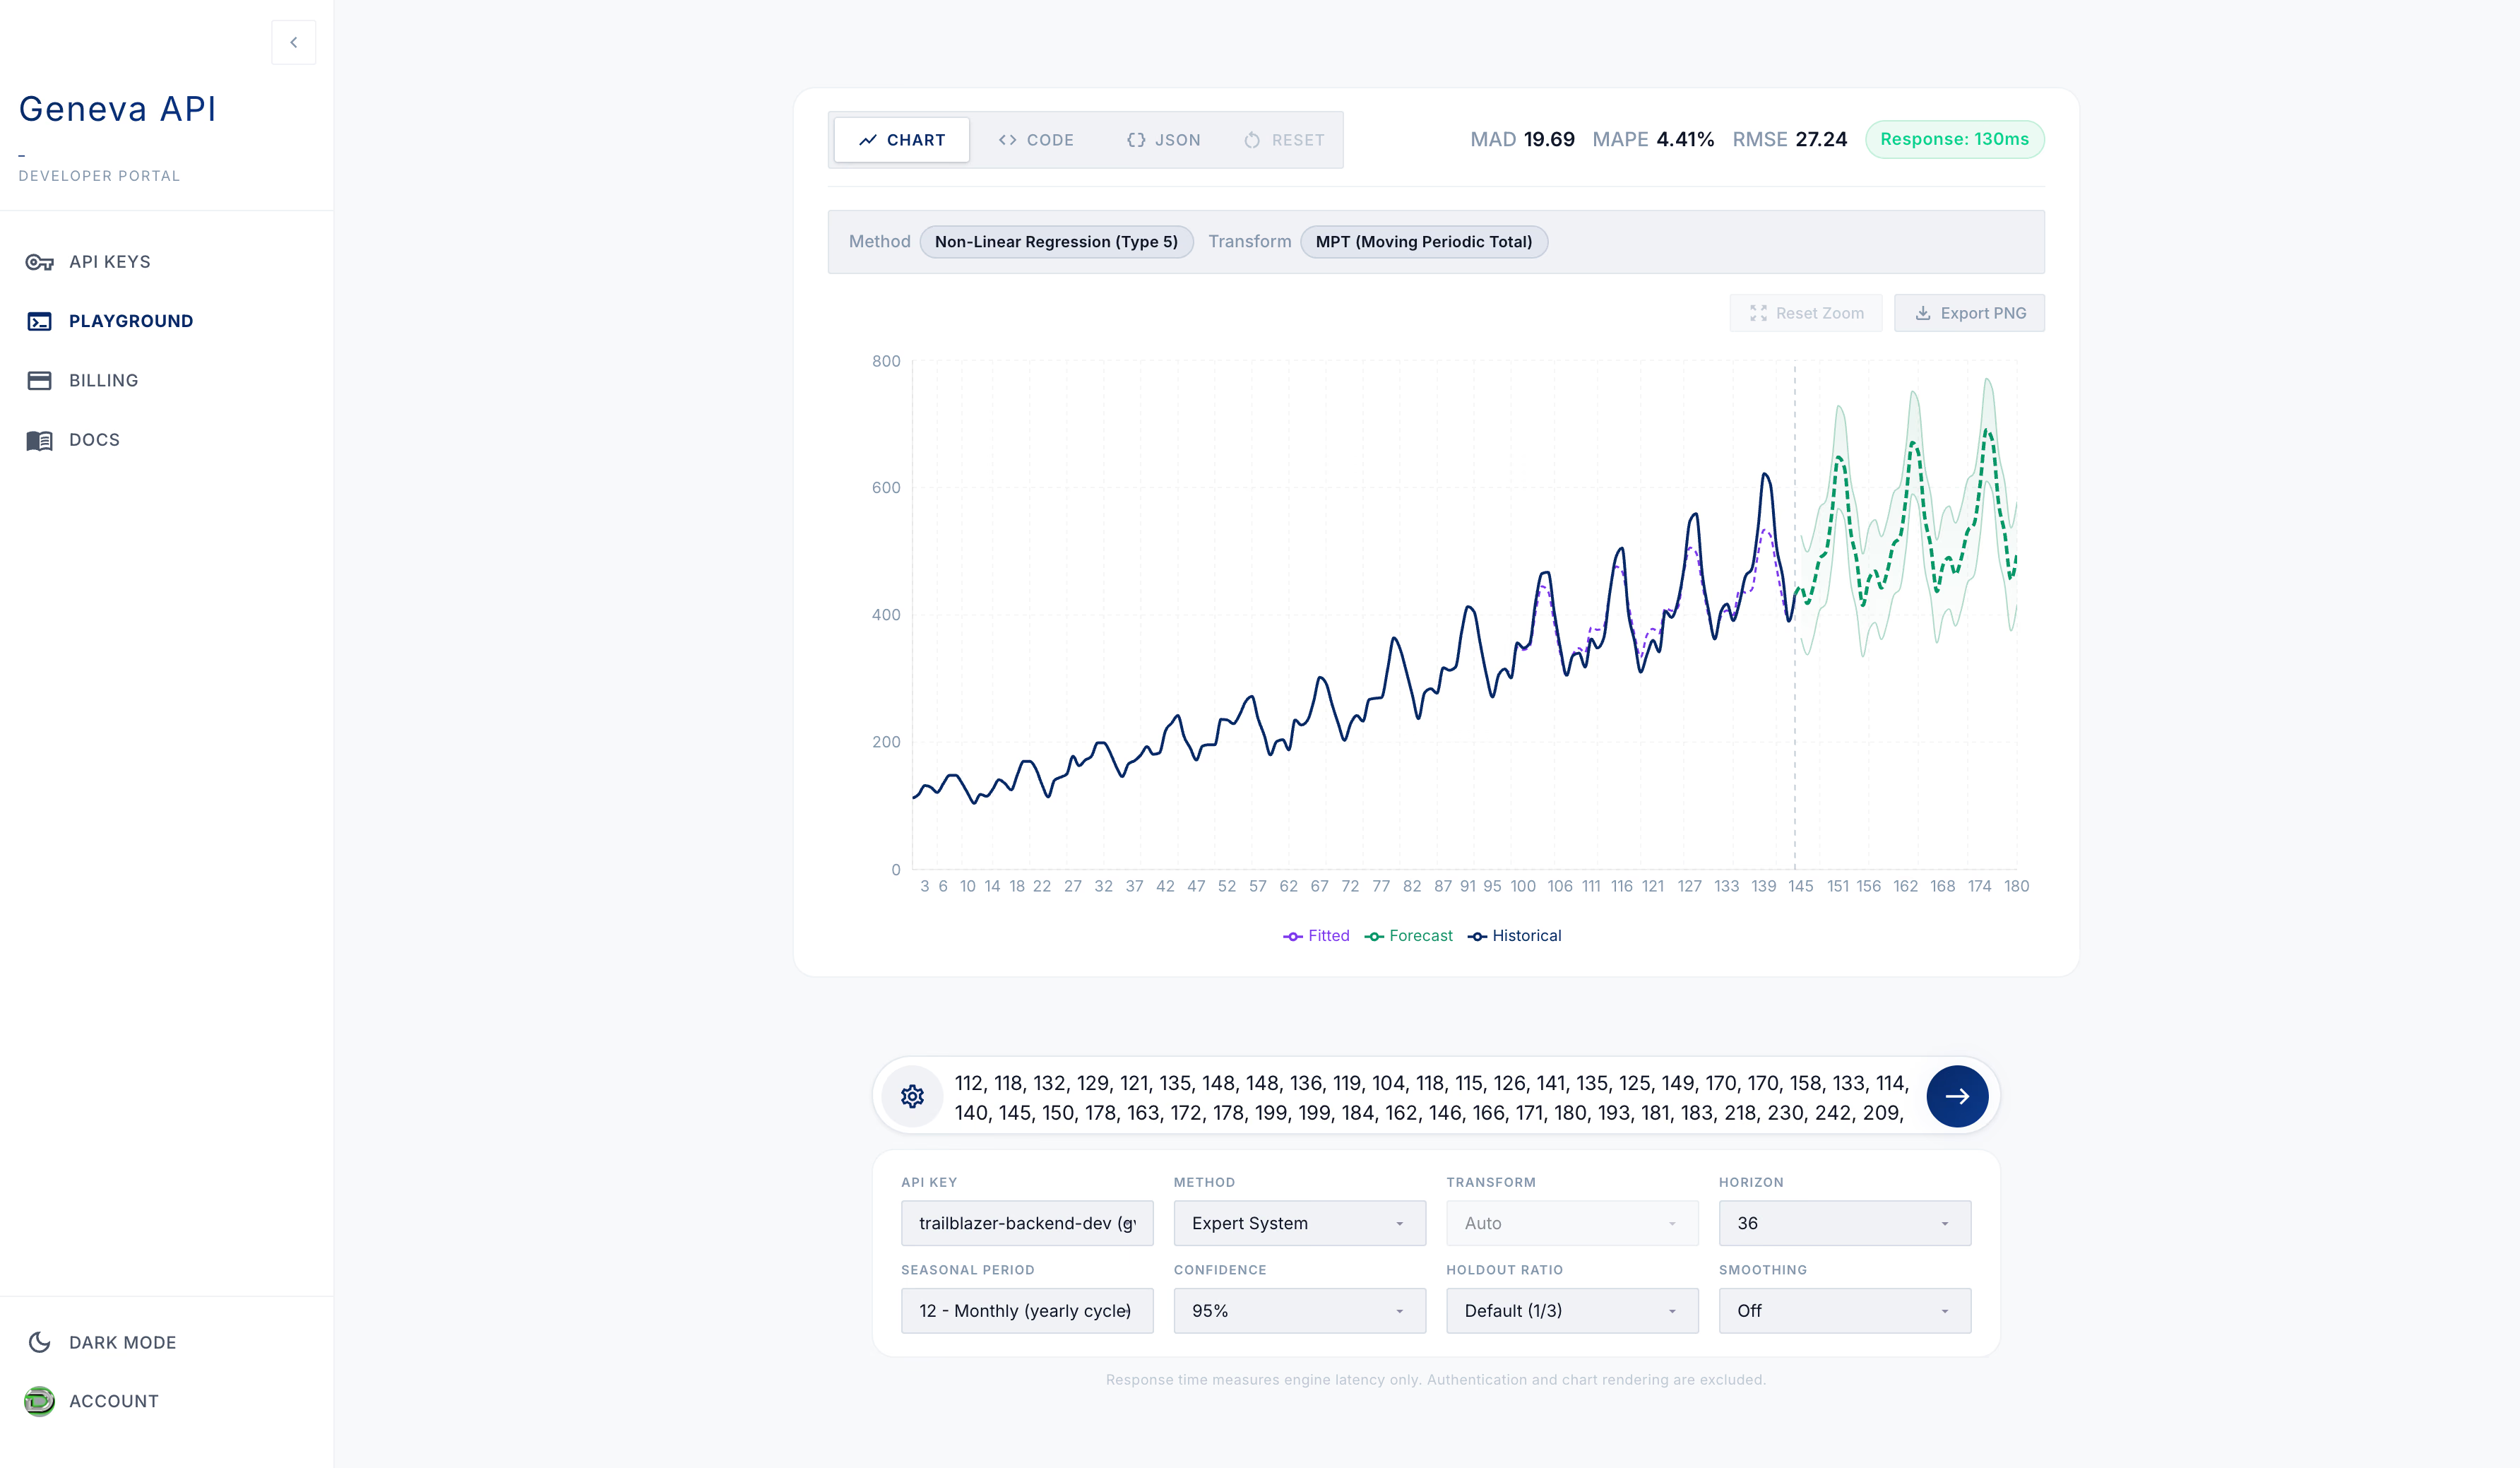
Automatic best-fit selection across 10 statistical methods. Send a series, get back a forecast, prediction intervals and fit metrics.
Forecast rises from 444 in period 145 to a peak of 691in period 175. Mean absolute percentage error on the holdout is 4.4%.
| Period | Forecast | Lower | Upper |
|---|---|---|---|
| 145 | 444.3 | 363.5 | 525.1 |
| 146 | 418.1 | 337.3 | 498.9 |
| 147 | 445.8 | 365.0 | 526.6 |
| 148 | 487.6 | 406.8 | 568.4 |
| 149 | 498.4 | 417.6 | 579.2 |
| 150 | 561.1 | 480.3 | 641.9 |
| 151 | 647.9 | 567.1 | 728.7 |
| 152 | 631.6 | 550.8 | 712.4 |
| 153 | 533.4 | 452.6 | 614.2 |
| 154 | 486.1 | 405.3 | 566.9 |
| 155 | 414.9 | 334.1 | 495.7 |
| 156 | 456.6 | 375.9 | 537.4 |
| 157 | 468.7 | 387.9 | 549.5 |
| 158 | 442.2 | 361.4 | 523.0 |
| 159 | 469.7 | 388.9 | 550.5 |
| 160 | 511.3 | 430.5 | 592.1 |
| 161 | 521.8 | 441.0 | 602.6 |
| 162 | 584.3 | 503.5 | 665.1 |
| 163 | 670.8 | 590.0 | 751.6 |
| 164 | 654.3 | 573.5 | 735.1 |
| 165 | 555.8 | 475.0 | 636.6 |
| 166 | 508.3 | 427.5 | 589.1 |
| 167 | 436.8 | 356.0 | 517.6 |
| 168 | 478.3 | 397.5 | 559.1 |
| 169 | 490.1 | 409.3 | 570.9 |
| 170 | 463.4 | 382.6 | 544.2 |
| 171 | 490.7 | 409.9 | 571.5 |
| 172 | 531.9 | 451.1 | 612.7 |
| 173 | 542.2 | 461.4 | 623.0 |
| 174 | 604.5 | 523.7 | 685.3 |
| 175 | 690.7 | 609.9 | 771.5 |
| 176 | 674.0 | 593.2 | 754.8 |
| 177 | 575.3 | 494.5 | 656.1 |
| 178 | 527.5 | 446.7 | 608.3 |
| 179 | 455.8 | 375.0 | 536.6 |
| 180 | 497.1 | 416.3 | 577.9 |
forecast.py
# pip install geneva-forecast
import os
from geneva_forecast import GenevaClient

client = GenevaClient(
    api_url="https://api.roadmap-tech.com",
    api_key=os.environ["GENEVA_API_KEY"],
)

result = client.forecast(
    data=monthly_sales,  # your history
    horizon=12,
    wave_periods=[12],
    confidence_level=0.95,
    include=["forecast", "prediction_intervals", "metrics", "model_info"],
)
print(result.model_info.method_name, result.metrics.mape)
claude_desktop_config.json
{
  "mcpServers": {
    "geneva": {
      "command": "uvx",
      "args": ["geneva-mcp"],
      "env": {
        "GENEVA_API_URL": "https://api.roadmap-tech.com",
        "GENEVA_API_KEY": "gva_your_key_here"
      }
    }
  }
}
curl -X POST https://api.roadmap-tech.com/forecast \
-H "X-API-Key: $GENEVA_API_KEY" \
-H "Content-Type: application/json" \
-d '{
"data": [112.0, 118.4, 132.1, 124.3, 121.1, 140.2, 148.9, 153.7,
136.2, 119.0, 104.0, 118.5, 121.3, 129.8, 138.5, 146.7,
128.4, 155.3, 162.8, 149.1, 141.7, 119.5, 108.2, 126.3],
"forecast_horizon": 12,
"wave_periods": [12],
"confidence_level": 0.95
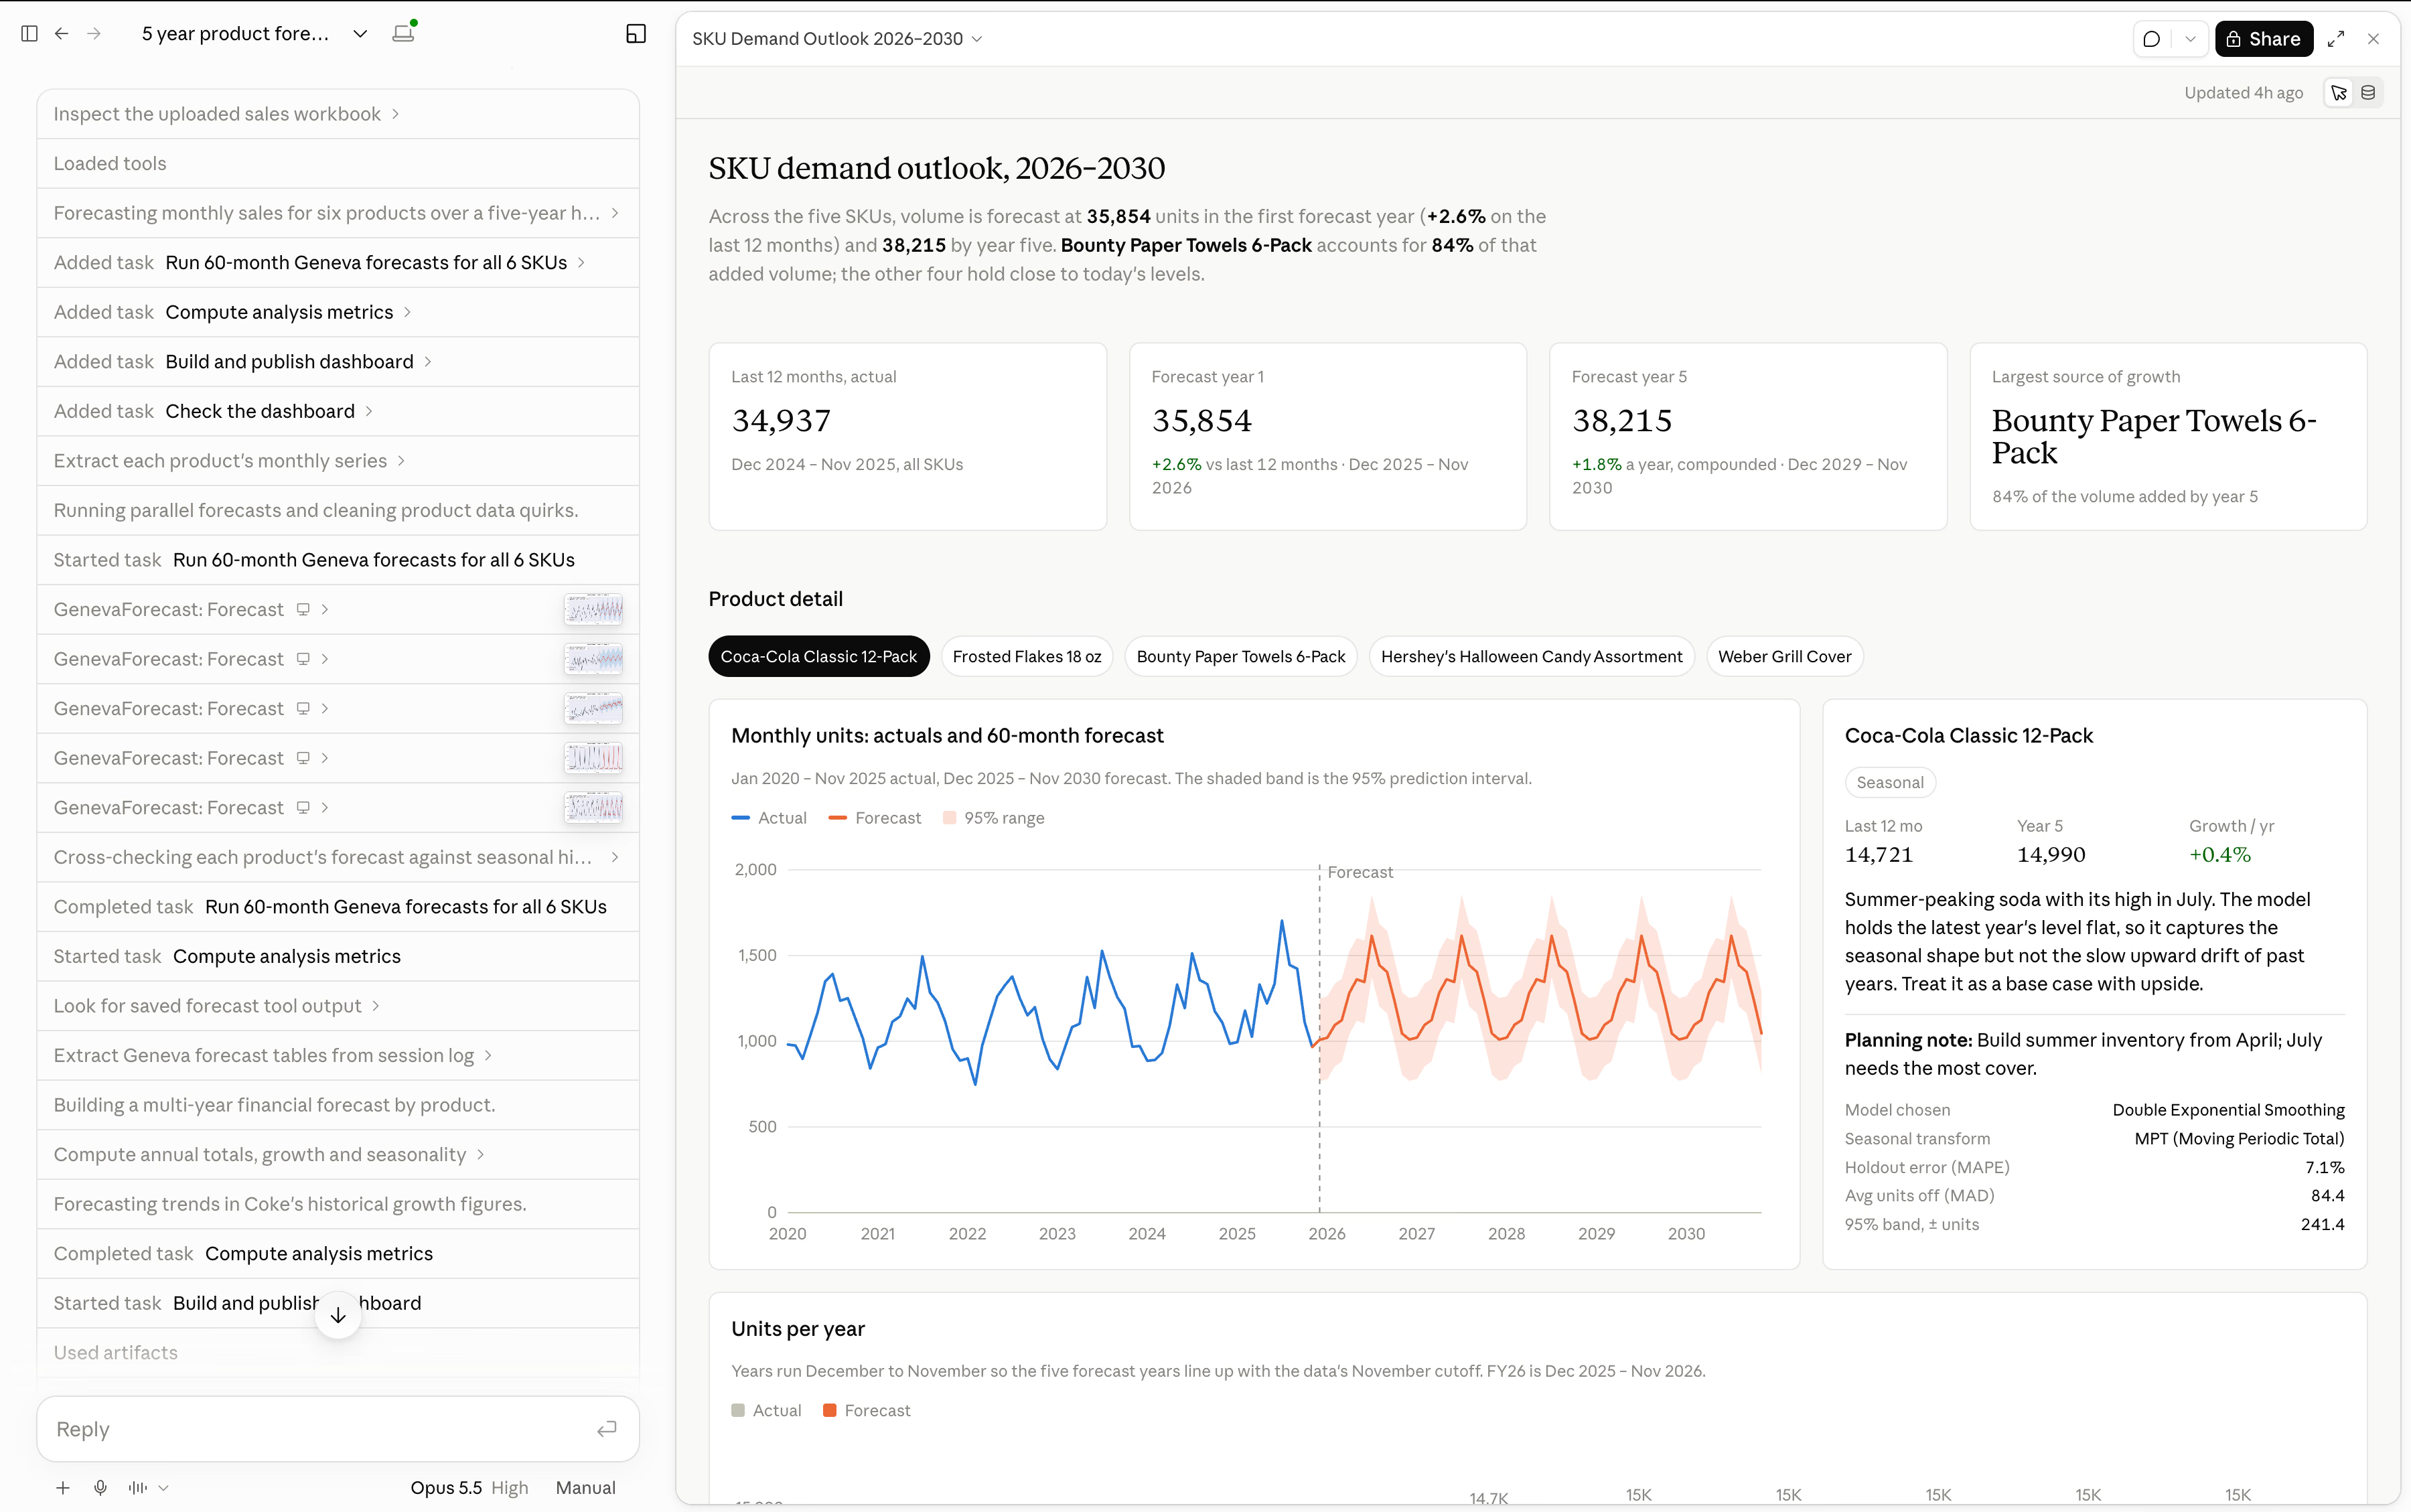
}'Add the Geneva MCP server to Claude and ask for a forecast in plain language. Claude picks the model, runs the forecast and builds the dashboard, with performance metrics and prediction intervals
pip install geneva-mcp
Forecasting experts who build, validate and operationalize demand models on your data.
Forecasting products built on the Geneva Forecasting™ Engine, from a free web app to an enterprise planning platform.
Explore forecasting softwareSecure pipelines, warehouses and governance that give your forecasts complete, current data.
Book a free 30-minute consultation. We'll look at your forecasting setup and tell you honestly whether we can help.
Kraft Foods partnered with RoadMap Technologies to replace sales-driven overrides with statistical baseline forecasting, econometric promotional lift modeling, and retailer-level profit simulation across its trade planning process.
Genentech partnered with RoadMap Technologies to unify short-term operational demand forecasts with long-range strategic supply plans across oncology, neurology, and transplant anti-infective therapy portfolios, eliminating the planning disconnects that drove inventory imbalances and capital misallocation.
Johnson & Johnson partnered with RoadMap Technologies to unify class-of-trade demand forecasting with Gross-to-Net financial reconciliation, closing the gap between supply chain planning and net revenue realization across its healthcare portfolio.
RoadMap Technologies is a forecasting and data science company founded in 1988. We offer consulting services, forecasting software and data services, all built on the Geneva Forecasting™ Engine, the statistical engine Oracle has licensed since 1999.
Geneva is an expert-system forecasting engine. For each time series it tests 10 statistical methods, tunes their parameters, detects seasonality and outliers, and selects the best fit. Oracle has licensed it since 1999, and it still ships inside Oracle Database 26 OLAP DML.
Life sciences, healthcare, retail and consumer goods, consumer electronics, media and entertainment, energy and utilities, manufacturing, finance, and government and defense. We have supported Fortune 500 companies and 10 of the Top 25 life science companies.
Most engagements start with a pilot. We typically have a governed demand model running on your data in about two weeks, and most clients see measurable results within 30 days.
If your team wants to run forecasts themselves, start with TrailBlazer or the Geneva API. If you need help building, validating and operationalizing models, or connecting them to S&OP, start with consulting. Many clients use both, and we can help you choose.